Here is a hierarchy of English words, in a decreasing order considering their Google searches according to Google Trends : of, free, sex, car, dog, gun, muscle, knife, torn, filming, separating, fooling.
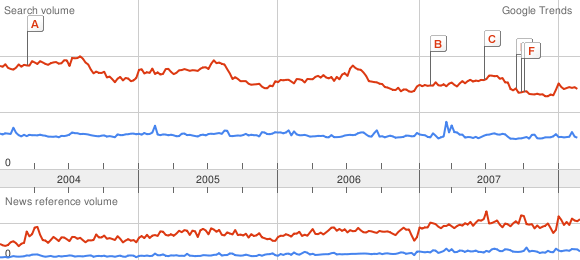
They can be used to create a scale for Google Trends. It may not be very accurate, but would still be useful to get quantitative values. To compute it, I google-trended pairs of successive words in the hierarchy above. This gives me the scale change for each pair, by measuring the height (in pixels) of the maximum of each curve. Here is a picture to explain what I mean:

As I do that for successive words, I get values like this:
Comparison cat ~ dog : 65 px ~ 113 px
Comparison dog ~ phone : 69 px ~ 113 px
thus I can deduce by a subtle use of the rule of three:
cat ~ dog ~ phone : 65 ~ 113 ~ 113*113/69=185,06
considering the scale of the first line or:
cat ~ dog ~ phone : 69*65/113=39,69 ~ 69 ~ 113
with the scale of the second one.
I did this computation for all 11 words to get the following maximum values, where I defined the reference as the maximum of fooling. Of course, I call this new unit the foo:
- fooling : 1 foo
- separating : 2,5 foo
- filming : 6,3 foo
- torn : 18 foo
- knife : 58 foo
- muscle : 120 foo
- gun : 240 foo
- dog : 640 foo
- car : 1500 foo
- sex : 3200 foo
- free : 6600 foo
- of : 16500 foo
 For example here about 800 foo for Manaudou in December 2007, to compare with the 240 foo of the Bruni peak, the 470 foo reached by Obama, the 1000 foo of Britney the 3200 foo of the tsunami de 2004 and the 5700 foo of... Janet Jackson after Superbowl 2004!
Now, let's get to the bad news:
- the error propagated by applying 10 times the rule of three will be the topic of my next post, quite technical (there will even be a pretty nice equation that neither Maple nor Mathematica can simplify)... just consider that the numbers above must be accurate +/- 10%.
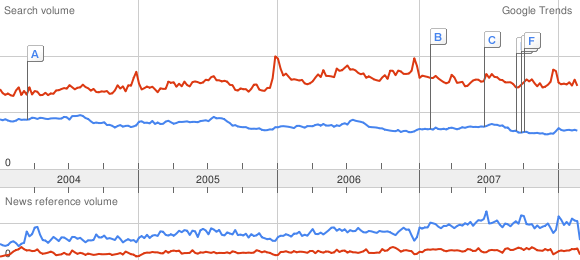
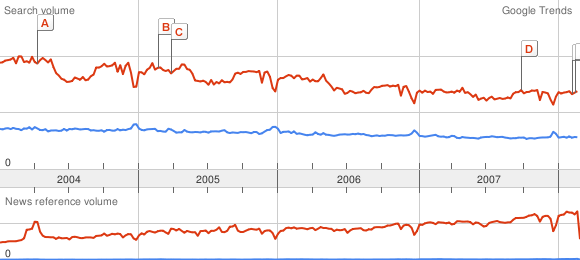
- the Google Trends curves vary a lot (maybe it's just a discretization problem, but in this case it's quite strange that the Google News discretization below is the same), as you can see on this animated gif (created with the great and simple UnFreez) :
 So be careful if you use one of those reference words: you have to remember the value of the peak, its position, but you may also want to superimpose the reference curve that I linked to the word, to check that the reference curve in the picture you're using has its max at the same place, and has the same scale. Try to correct it if it's not the case.
- the scale remains relative, to get an absolute one the question would be: how many Google requests is 1 foo? After my post in French, I got some pretty good comments on this idea, I sum them up here. First we have to be careful that the curves don't show the number of searches, but just the proportion of searches for a word among all searches in some period of time. This would explain why the Janet Jackson buzz was so high, it's difficult to compare the number of searches corresponding to 5700 foo in 2004 to 800 foo today. Anyway it's still possible to get an idea of the proportion from the number of searches, by trying to find data on the evolution of the number of Google searches in the past years, this must exist on the web (Alexa, at least...). Let's be more accurate about these values: on the 2004-2008 pictures, as I said I have no idea how the discretization is made, however on the yearly or monthly pictures, it's quite clear that we find, respectively, the weekly and the daily numbers. So what I'm looking for right now is, for some word, the number of searches it corresponds to. Elandrael had the brilliant idea of using Google Adwords stats, to get at least a lower bound on this number. For the moment I only got one Google Adword to apply this idea, which would show that a one foo peak corresponds to more than 20000 searches in a month, that is more than 4000 searches if we look at the weekly value in a yearly curve. So of course I would love to get some other statistics like this to confront the data, just contact me privately if you don't want to write on this blog the Adword you're paying for and its stats. On the same principle, you can also contact me if you have the stats for a common word in which your website appears as the first Google Answer.
This post was originally published in French: Rétroingéniérie de Google Trends.
Source files: the Google Trends curves of each word are linked above, here is the spreadsheet file that I used to compute the values in foo (it's quite a mess though, more details to understand it in my next post).
1 comment:
Reverse engineering helps to make a duplicate of an exiting product or enhance the quality of the product. Reverse engineering can help you to bit your competitor. We provide the best reverse engineering service in Alberta. Best reverse engineering Calgary, Alberta
Post a Comment